
Very few people would start a journey without knowing where they are going, how to get there, measure progress & tell when they arrive. True, we've had some awesome holidays by picking a direction & seeing where we end up, but even there, we knew what we were looking for (a place to enjoy) & a direction. A bit like learning a skill / art for its own sake rather than to achieve a particular goal. An approach to life & learning which I do enjoy, you end up doing things in places you never imagined, but I digress... Most people start a fitness / nutrition programme with specific goals in mind. The questions are: How do you gauge progress in order to make adjustments along the way? & How do you know you've arrived?
Continuing with the travel analogy, before you can plan a route to your destination you need to know your starting point (the initial assessment). Once you know where you are & where you'd like to go, you can plan your route (the programme). You will need gauges in your vehicle & signs along the way to tell you where you are & how you are doing (regular follow up assessments). In addition you will need your travelog (training / food diary), so that you know how you got from A to P & at each stage along the way.
It is one thing to believe that a training / nutrition programme will work; it is another to know that it does. The only way to know for sure is to take a scientific approach. To paraphrase 'the amazing' James Randi:
The reason people are fooled by quackery is that we as humans tend to more accurately remember the hits than the misses. In essence that is what distinguishes science from quackery, the method, in science we record everything & then see if it really works or not. Science is a verb, its a way of doing things.
i.e. we need valid repeatable tests to ensure that what we are doing, really is working.
The Assessments
With the end goal in mind a battery of tests (sounds a lot scarier than it is) is devised that measure the required attributes / skills. The tests employed fall into 10 broad categories each of which has multiple tests suited to particular needs:
- biometric
- nutritional
- movement
- strength
- speed
- power
- agility
- muscular endurance
- aerobic endurance
- anaerobic endurance
For many sports based goals the choices are simple as there are standard tests employed & it's simply a matter of duplicating them. For the more esoteric goals, the tests need to be carefully chosen. As a matter of interest as of this year's (2013) UFC Fan Expo there will, for the first time, be an MMA Draft with a standard set of tests for MMA athletes which we can now use to compare ourselves / clients.
That brings me to my next point. Assessments don't only give us a chance to set a start point & monitor progress but also to compare ourselves to norms, peers, competition etc. For the example below I have chosen one of my favourite biometrics, the lean/fat ratio. Please note, this example is a simplification; it is necessary to look at all the results not just one or 2 metrics as we will here.
The ratio is a very good indicator of power to weight, essential for almost all sports & activities. In fact it can be argued that there is no such thing as a true endurance event. All events are over a fixed distance (or less commonly fixed time) & it is the person who does it fastest (or goes furtherest) that wins. The very definition of power (work/time).
By combining known lean/fat & body compositions ratios from previous research & published tables of norms we are able to create ranges as per the graph below. The good range refers to the range in normal healthy people, excellent is that of serious amateur & professional athletes.
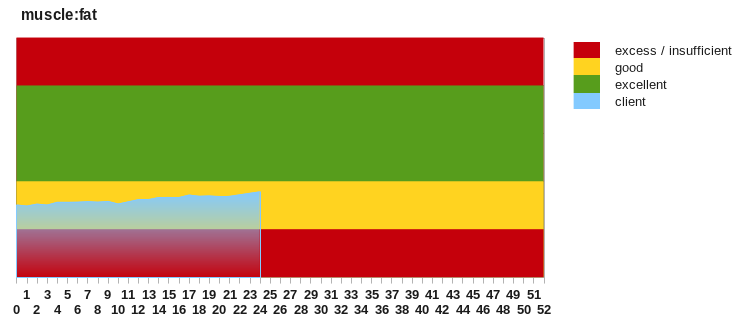
muscle/fat ratio with comparative ranges
This particular client has a 2 year goal to reach her ideal fight weight, which is derived from the ideal muscle to fat ratio.
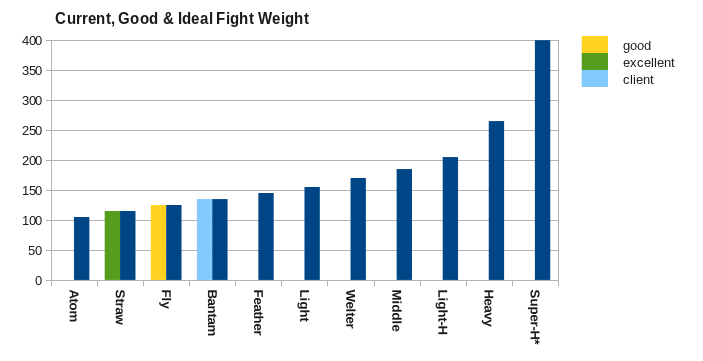
The clients current, good & ideal fight weights.
This is more clearly illustrated by the zoomed in chart below. The y-axis has been set so that the movements of the ratio are more obvious. The trend line shows the progress towards that goal (note that the x-axis is for only the first 52 weeks).
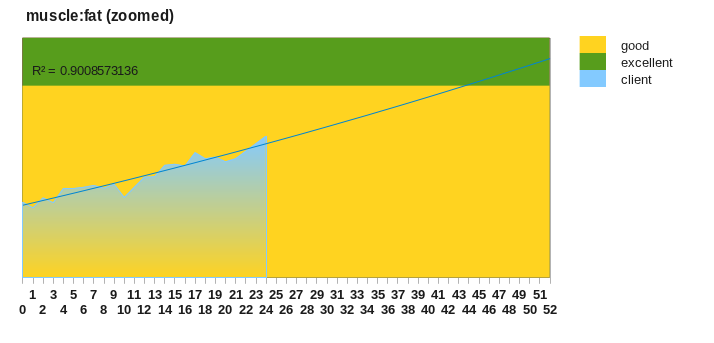
Muscle/fat zoomed for analysis.
This is especially useful when trying to figure out "what went wrong/right" during periods of training. Why the sudden drop & recovery in the ratio in weeks 9 - 11? What about the sustained improvement from week 21 - 24?
Training & Food Diaries
In order to answer these questions we turn to the diaries, in particular we'll look at the prescription vs. compliance. The graph below shows how the client, spurred on by the success of the 1st 4 week micro-cycle (more on periodisation in future post), over trained & didn't rest properly & as a consequence lost muscle mass.
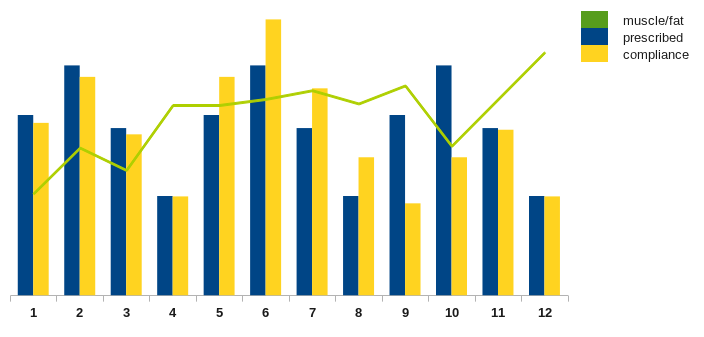
Muscle/fat overlaid on prescribed vs. compliance.
The client hadn't heeded the over-training warnings that her electronic diary was giving her (see below) & she paid the price with a loss of muscle mass, but fortunately since she was being monitored & the problem was addressed & corrected promptly. Remember it's better to be 90% fit than 101%.
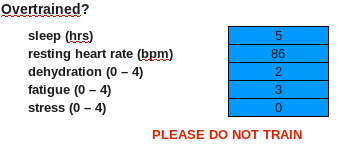
Warning from the training diary
Hopefully through the travel analogy & the simple example I've presented here, I've convinced you that even though filling in your training diary can seem to be a chore it is worth the effort.