"Analytics is the discovery, interpretation, and communication of meaningful patterns in data. Especially valuable in areas rich with recorded information, analytics relies on the simultaneous application of statistics, computer programming and operations research to quantify performance." -- Wikipedia
Just around the time my career as a quantitative analyst in the financial markets was drawing to an end, the movie Moneyball raised the public's awareness of the use of analytics in the sport arena. Sport analytics has been around for a very long time, HowzStat for example contains data for every international cricket player / match since 1877 & FightMetric has been providing MMA stats & analysis since 2007.Naturally analytics cannot replace understanding, experience & talent, however they can & are used to inform decision making. Ultimately analysis should answer questions & test hypotheses:
- How did I perform?
- In which areas am I / is my opponent strongest / weakest?
- What is the most probable outcome?
- Who is really the best at ... ?
- Is the 'south-paw advantage' real?
- Are judges biased?
- Have the bookmakers mispriced the match-up?
As an introduction to analytics I'm going to show you some of the ways it's used in our fighter preparation process. In particular I'll look at the quarterly Combat Readiness Evaluation (CRE). I won't bore you with too much detail, I hope.We started with the questions:
- How well have the students assimilated the syllabus? i.e. Are we succeeding as coaches?
- Where is each strongest & where do they need the most help? i.e. How do we best help our students achieve their goals?
Data
As the name implies quantitative analysis requires data. Lots of it. In the sports arena the bulk comes from analysing video in ultra-slow motion to record specific actions & to measure other metrics like speed, acceleration & distance traveled. GPS & RFID are also used in many sports, often providing an overlap of data. The various metrics can then be combined to create more complex metrics. For example: taking the number of strikes a fighter attempts & dividing by the fight time to get the number of strikes attempted per minute.Some sports are easier to analyse quantitatively than others. Cricket & Baseball with their rigid structures, rules & simplicity lend themselves to analysis & new metrics are developed regularly, many by the fans. MMA on the other hand is incredibly complex. If we look at striking for example & follow the Fightmetric (the leader in MMA statistics) model. Punches, elbows, knees, kicks etc are all counted simply as strikes. Strikes are then split by:
- range: distance (we prefer stand-up), clinch or ground
- target: head, body or legs
- power: power or jab
- landed: attempted or landed
So the metric for a standing jab to the head would be 'distance-head-jab-landed'. Even with that massive simplification you end up with 36 possible metrics.To get the data we needed for our analyses we defined 100+ base metrics measuring everything from strikes & submissions to takedowns, reversals and advances. We then defined a further 100+ compound metrics to be evaluated. The focus was to measure relative effectiveness. Our competitive (or soon to be) students where grouped by mass & experience. We had them spar with each other for set periods in set positions to ensure we covered all ranges & possibilities. These sessions were filmed from multiple angles & the video was interrogated to produce around 19,000 data points for the 12 students who participated.To this we add all the fitness, attendance & biometric data that we've been collecting.All the data was normalised to give a score out of 10, where 10 equates to the top 2% of athletes in the world. While a score of 3-3.5 implies that the person is 'average'.
Analysis
Is our coaching effective?
A scary question to ask. What if they could get further by simply getting fitter? Aren't fighters super-fit & aways trying to get fitter? Maybe that's the key.
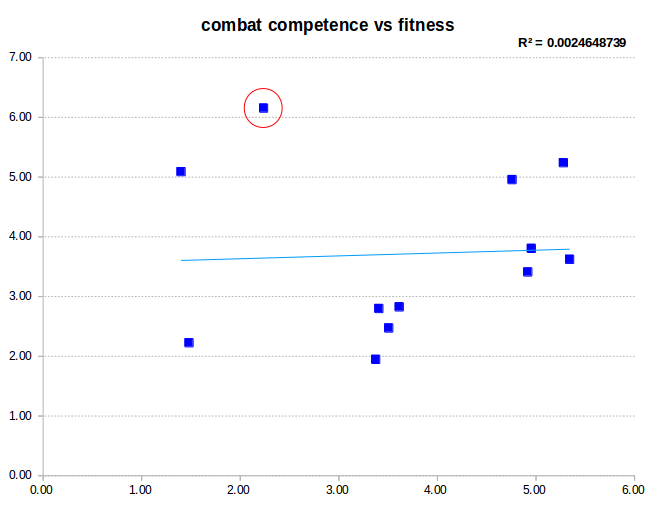
Fitness is a poor indicator of fight ability. That doesn't mean it isn't incredibly important though...
The scatter plot of combat competence (fight ability) vs fitness shows that there is no relationship between the 2. The coefficient of correlation (R2), the degree to which one variable explains the other, shows that fitness does not explain fight ability. It is interesting to note that the best performers are all fairly fit though. We are not claiming that one does not need to be fit to fight but rather that fitness by itself does not make a fighter.
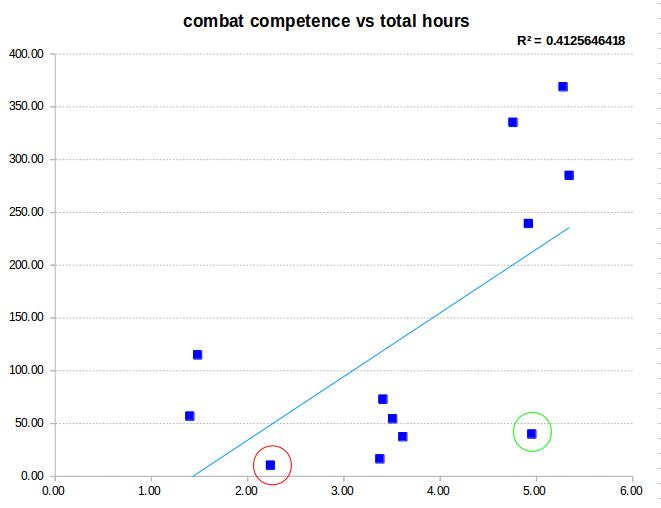
The more time one spends in the gym the better one fights...
The amount of time one spends training technique is a good predictor of fight ability including when expressed as attendance per week (see below). The point circled in red is the fittest person, note though that their performance correlates with their experience (attendance in technical classes) rather than their fitness.
The point circled in green is our 'rookie of the year'. showing how this kind of analysis can also be used for 'talent scouting'.
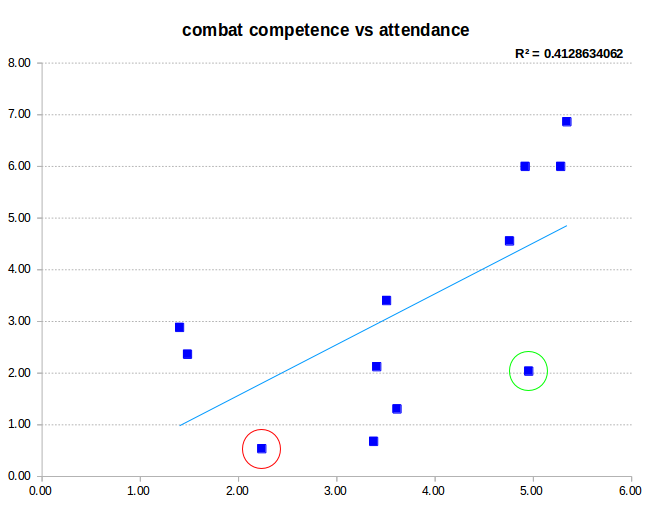
Hours per week of technical training correlates well with fight ability.
Whilst I am aware that this is a small sample size & the testing was done in sparring not fighting, I'm willing to claim that our coaching is effective.
How do we best help our students achieve their goals?
To answer this question, I'll go through the quarterly CRE report that we produce for each student. The report is a basic summary of the analyses so I will delve deeper at times to show you how we can gain further insight.We, as coaches, have set requirements for students to be eligible to compete in combat sports (more on the requirements at a later). The same analyses also form the foundation of our performance goal setting process. How could / why would you choose to improve your takedown accuracy for example if you don't know what it is or what the international norms are?
Aggregate
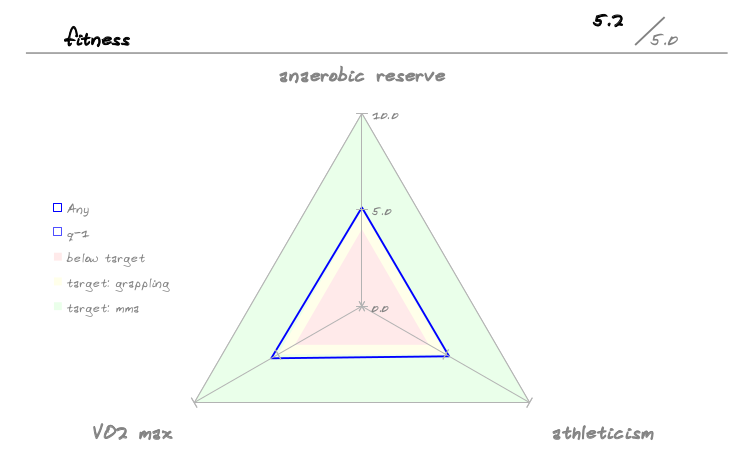
In data science aggregation (also called reduction) can take numerous forms: sum; mean; standard deviation etc. Here we look at the unweighted-mean (simple average) of the 3 major components of the CRE: combat competence (fight ability); fitness & attendance i.e. we believe all 3 to be equally important. The student must meet the required aggregate, 5.0 in this case since 'Any Student' (names have been changed to protect the innocent...) is over 17, in order to qualify to compete in MMA
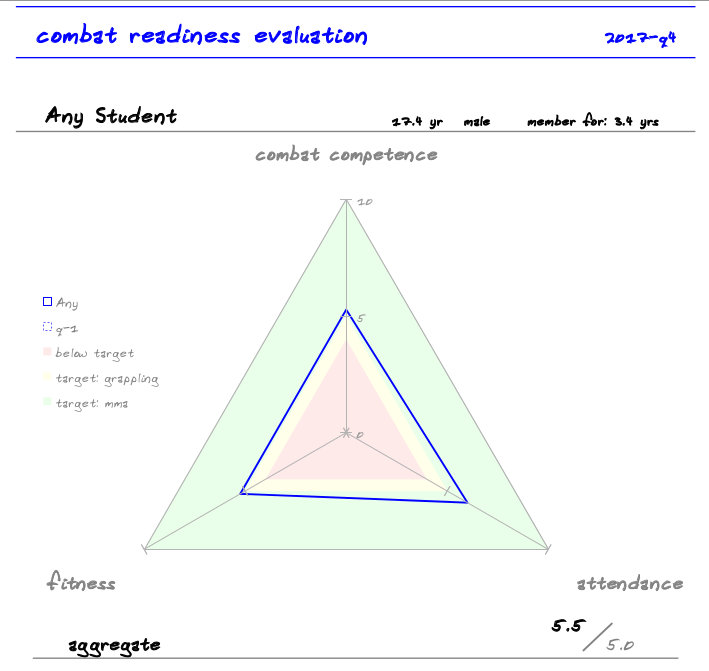
The radar plot, shows the components of the aggregate. At a glance the student can see their relative strengths & weaknesses.
'Any' has achieved the MMA target in all 3 components, his line is 'in the green'. If he only wanted to grapple he would have to aim for the yellow area. Grappling has a lower requirement, 4.5 in this case. The 3 components give us information about different aspects. Combat competence is a measure of a students tactical abilities, can they implement there game plan? Fitness is just that, while attendance is used to read sentiment (commitment amongst other things).He is currently attending 6 hours of technical classes per week. This is an increase on his usual attendance (more below) which, given the analysis on competence vs attendance above, should translate into an improvement in his competence rating in future.let's take a look at the details of the components...
Combat Competence
Here we are analysing the students ability to effectively implement their will on their peers. The aggregation in this case is a complex weighted-mean. Techniques that end fights are weighted higher than those that, while are important aspects of fighting are not capable of winning fights. So strikes & submission attempts count more than range transitions (takedowns & get-ups) which in turn count more than reversals, which count more than advances & so on. The weighting also takes into account the frequency & accuracy of these techniques.
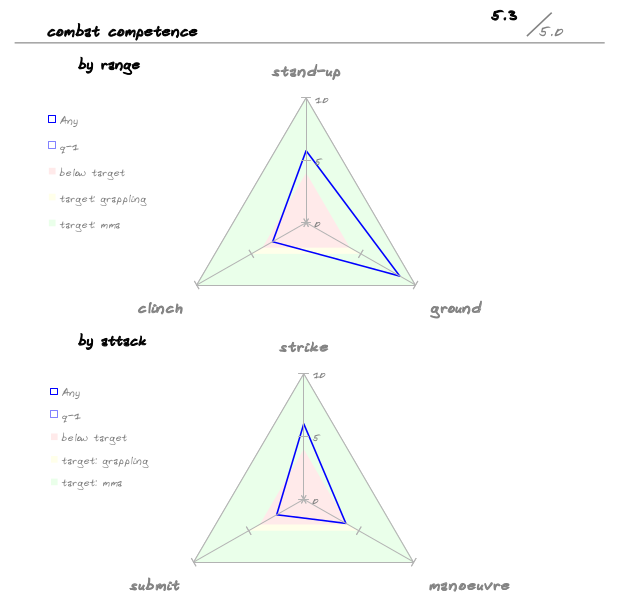
combat competence sliced by range: stand-up; clinch & ground & attack: strikes; submissions & manoeuvers.
From these plots it's immediately apparent that 'Any's' ground game is superb, his stand-up is good however his clinch requires work. Likewise his striking & manoeuvering (some examples are takedowns & get-ups, clinch entries & exits, positional advances like passing guard etc) however his submission game is lacking a little.Already we are gaining insight. Lets look a little deeper, the CRE also includes a graph of the attacks by range.
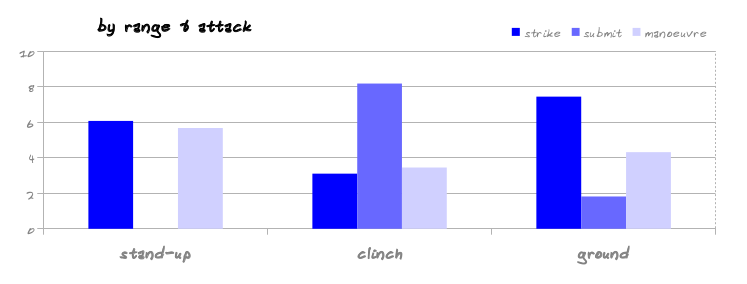
By looking at the attacks by range we get an even clearer picture.
A few things that stand out now are: although his clinch game as a whole is lacking as is his submission game, his clinch submissions are excellent; his ground game is based on striking i.e. ground & pound; his stand-up is well rounded (stand-up submissions are incredibly rare, you don't see many flying arm-bars / ankle-locks etc).Even though the CRE doesn't present it, our system allows us to delve deeper. I'm going to dig a little deeper into 'Any's' striking, in particular his stand-up to give you an idea of what is possible. I've chosen the stand-up striking component because it is easiest for most people to understand.
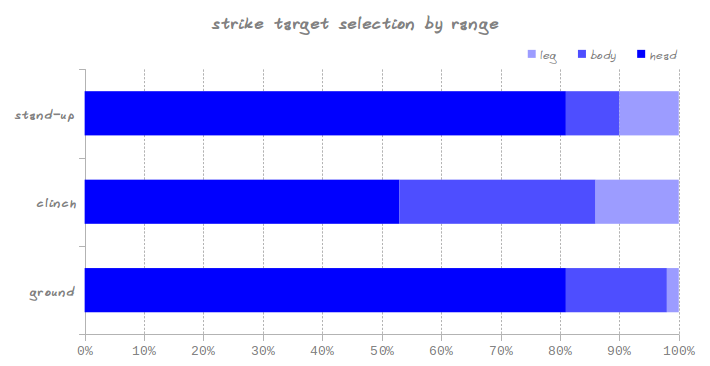
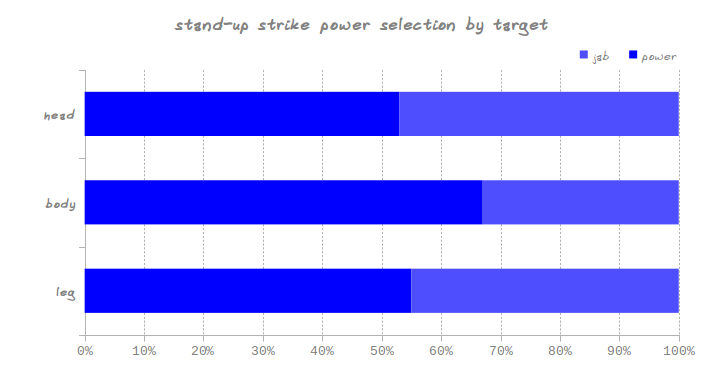
The primary target in striking is the head.
This chart shows the proportion of strikes by target (head, body or leg) selection for each range. Rather than normalising the data to yield a score out of 10, I have expressed them as percentages which make more sense in this instance. The draw back is that the chart doesn't give a relative to international norms, rather it presents absolute values. We tend to look at both. 'Any's' shot selection is very close to international norms (as expressed by UFC average data) though.Not surprisingly the head is always the primary target. The higher proportion of body & leg strikes in the clinch is usually attributed to the proximity & the availability of knee strikes. The low leg strike rate on the ground is because there are few ways of striking at the legs without compromising your control & why bother with the head so accessible?
Let's 'zoom' in another level & look at the stand-up portion of his striking game, the selection of striking power.
A higher percentage of stand-up-body-power-attempts is expected.
The higher percentage of power shots to the body is largely due to the need to throw kicks at the body with speed & force to prevent the leg being caught. Jabs in general should never be discounted though, while they may not often end fights they often set up the power shots that do & they serve a myriad other purposes too.'Any's' ratios when compared to international norms, presented here as the average of the UFC roster (source: Fightnomics) for illustrative purposes (see aside below), are higher for the head & body, but lower for the leg.
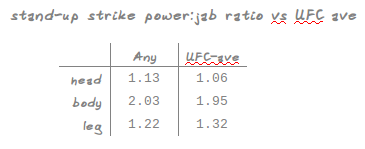
Interestingly 'Any's' head & body ratios are higher, while his leg ratio is lower than the norm i.e. he attempts more power shots than the norm.
Since I know 'Any' uses a well timed teap, essentially a leg jab, to arrest the forward motion of his opponent the lower leg ratio makes perfect sense. The head & body ratios are interesting though.
aside: there are many types of averages: mean, mode, median etc & many ways of calculating them depending on the context. A simple arithmetic mean like the one used to aggregate the fitness components below has meaning in that context. However population means like the UFC averages quoted above require some measure of dispersion, standard deviation for example that would give us a better feel of what is the normal range of the population. Given the mean & standard deviation one could plot the appropriate distribution, which can then be used for normalisation etc. For this reason we have done our own analyses to drive our normalisation processes.
Let's take a different perspective, let's look at his striking accuracy.
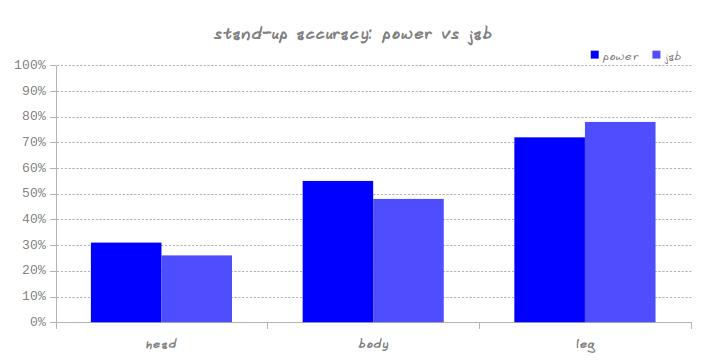
Even more interesting his jab accuracy is below that of his power shots for both the body &head.
We would expect a fighters jabs to be more accurate & the norms confirm this, however 'Any's' head & body jabs are less. Why? When I showed him these analyses he told me he'd had an injured elbow the week of the TacTests (tactical tests) as they are known in the gym. Mystery solved.Before we move on I would just like to point out that the increase in accuracy as a whole from head to leg, is largely due to the fact that it's easier to move ones head than leg out of the way of an incoming strike.We've only had the briefest look at 1 very small part of the striking game...
Given the massive amount of video footage available, there are probably not enough capable humans on the planet to be able to extract all the possible findings. - Tom Davenport
Fitness
While fitness may not make a fighter, the lack thereof will quickly break one...
Fatigue makes cowards of us all. - Anon.
The fitness aggregate is an unweighted-mean of it's components. Again we value all 3 equally.
We perform our standard fitness tests (athleticism) for all students who are interested at the end of every month. This gives them a way of keeping track, & provides us with data & insights. Let's break down 'Any's' athleticism score.
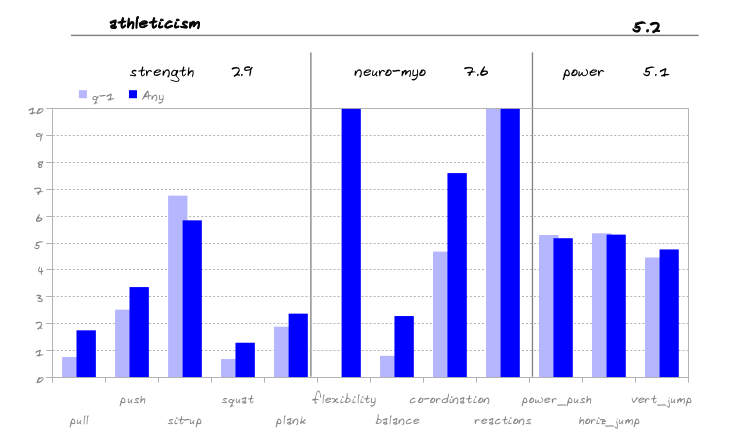
'Any's' Power scores are consistent & high enough, however strength neuro-muscular components have gaps. Room for improvement.
Power is a combination of strength & 'speed', a neuro-muscular components. 'Any's' strength is a little lower than expected (at least as measured traditionally), however combined with his higher neuro-myo capabilities he is capable of producing more than sufficient power. The gaps provide opportunity for large improvements.The anaerobic reserve & VO2max are done quarterly & used as measures of the students metabolic conditioning, training the various energy systems to provide timeously & for the duration. The anaerobic reserve is calculated as the ratio of the 1st 3 sets of burpees to the last 3. The VO2max is calculated from a race pace run of a distance determined by the students age. The target time is adjusted according to the student's gender & mass. As a 17+yr welter-weight male with aspirations of becoming a MMA fighter 'Any' is required to run 21km in 2:18:13 to score the required 5.0. To give you a flavour for the normalisation a score of 10 would equate to a 1:16:37 half marathon for 'Any'.
Attendance
Attendance data gives us an idea of the sentiment of a student in the same way one might read the market sentiment through technical analysis. In fact one can use these techniques on any time series. The interpretation would vary depending on the data presented though. Here we present the attendance data as a 3 month moving average so as to not penalise students for being sick or on leave.
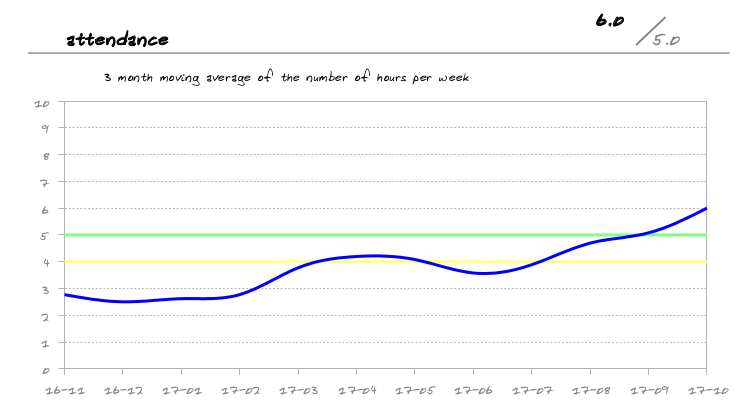
'Any's' attendance has been rising over the last year.
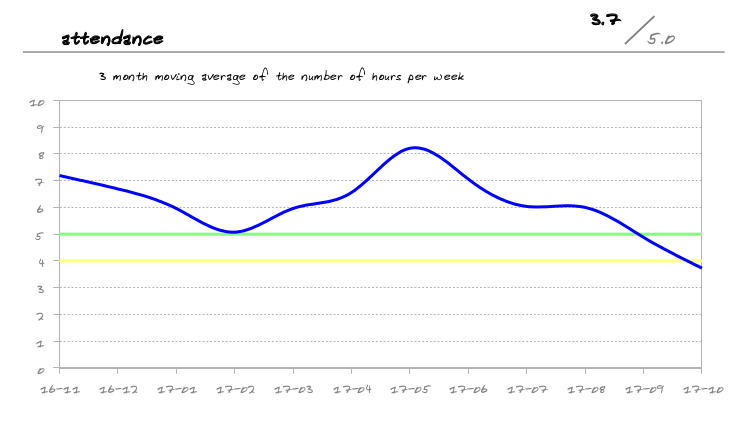
Contrast 'Any's' chart to 'Another Student's'.
'Another' seems to have lost interest.
'Another's' chart shows him testing the psychological resistance level of his attendance requirements in February, peaking in May before crashing through the resistance levels. Reasons aside it is quite clear that 'Another' has lost his passion. Hopefully not to late to intervene...
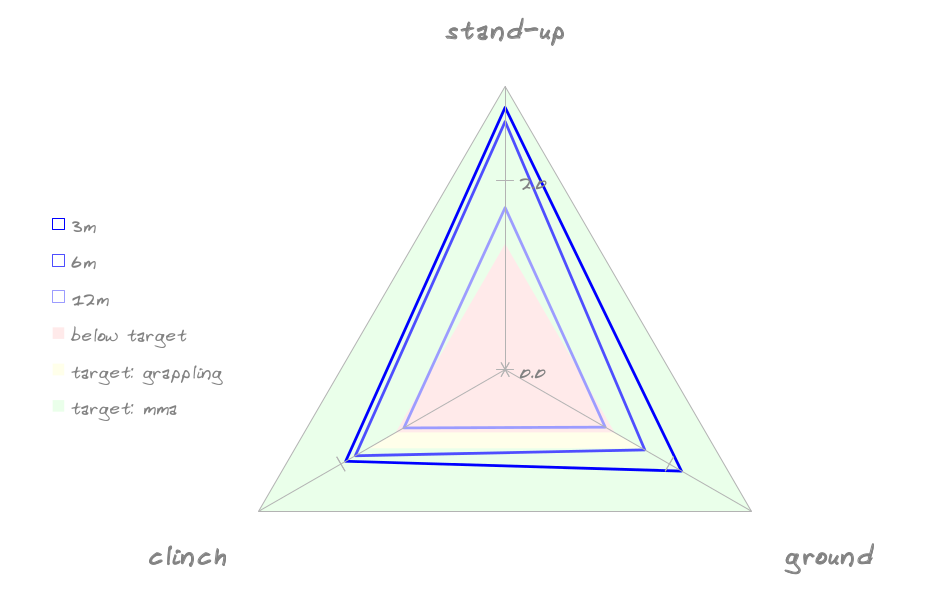
Keeping track of what is taught in each class we are able to break students attendance down into ranges for example. Here we look at the range split over time of a 'Different Student'.
'Different' has not only increased attendance over time he has shifted the split towards his weakest range, stand-up.
'Different's' radar plot shows that not only has he consistently increased his attendance but he has shifted his focus towards stand-up, his weakest area, without reducing the time spent on his strengths.
Other Analytics
Besides for the CRE we use analytics to compare student's biometrics with international norms to determine the most appropriate weight class for them. More on this & other analytics soon...